FAQ SoilGrids 2017
This page refers to the SoilGrids version published in 2017 (Hengl et al. 2017).
These maps can be downloaded from here.
For information about the most recent version of SoilGrids, please refer to the latest information at https://www.isric.org/explore/soilgrids
Contents
- What is "SoilGrids"?
- What are "updatable soil property maps"?
- What is automated global soil mapping?
- What do the filename codes mean?
- How were the legends generated?
- How were the spatial predictions generated?
- Who makes the spatial predictions?
- How were the models selected?
- What soil data is included?
- How much does it cost?
- How can I access SoilGrids?
- Why coarse resolution?
- Soil mask map
- How is SoilGrids related to the GlobalSoilMap project?
- Why do SoilGrids include also maps of soil types?
- How accurate are SoilGrids predictions?
- How can I help improve SoilGrids?
- How can SoilGrids help me improve soil maps for my country?
- Cited sources
What is "SoilGrids"?
SoilGrids is a system for automated soil mapping based on global soil profile and covariate data (Hengl et al. 2014; Hengl et al. 2017). SoilGrids1km, SoilGrids250m are outputs of spatial predictions produced using the SoilGrids system, i.e. a collection of updatable soil property and class maps of the world (ca 300 GeoTiffs) produced using machine learning and statistics. These predictions represent the initial outputs of a planned series of global map products (SoilGrids1km, SoilGrids250m, SoilGrids100m ...) that will be produced in collaboration with our partners in the years to come. SoilGrids predictions are a global soil data product generated at ISRIC — World Soil Information as a result of international collaboration and as a proposed contribution to the Global Soil Partnership initiative (Montanarella & Vargas 2012). For more technical and scientific information about SoilGrids contact the development team. For more info about ISRIC and collaboration possibilities please contact the ISRIC Director.
-
SoilGrids250m = a Global 3D Soil Information System at 250 m spatial resolution
-
SoilGrids = a system for automated soil mapping (SoilGrids250m spatial predictions are an output of the SoilGrids system)
What are "updatable soil maps"?
SoilGrids spatial predictions (layers) will be produced using automated soil mapping with no user intervention, and can therefore be regularly updated as new soil data arrives (subsequent to quality control and data standardization/harmonization) i.e. maps could be updated soon after new data arrives. We refer to these hence as "updatable soil property and class maps". Each GeoTiff available from the SoilGrids.org website carries the production date in the metadata, enabling different versions of the maps to be traced and compared. For more info see:
What is automated global soil mapping?
Automated global soil mapping is a data-driven approach to soil mapping with little or no human interaction, commonly based on using optimal (where possible) statistical methods that produce predictions rapidly and efficiently. Within the SoilGrids project we primarily aim at using model-based geostatistics (Diggle and Ribeiro, 2007; Brown, 2014) and/or machine learning techniques (Hengl et al, 2015; Hengl et al. 2016) to generate predictions. The first version of SoilGrids1km was generated using only regression modeling; the second generation of SoilGrids at 250 m was fully based on Machine Learning. The statistical models we fit are global models, which means that they have been calibrated to make unbiased predictions at any location within the global soil mask. In summary, the term "automated global soil mapping" implies that: (a) the predictions are based on global statistical models, and (b) the programming is implemented in such a way that model fitting and spatial prediction can be automated. This approach to global soil mapping is also referred to as "top-down" mapping. Compare with "bottom-up" mapping where series of independent predictions are generated and then merged to create a global map.
In principle, we currently focus on the models that are able to generate predictions at targeted resolution within a 24 hr period per soil variable of interest (usually at 7 depths). It is probably possible to increase accuracy of the predictions by using even more sophisticated statistical models, however for practical purposes and as a rule of thumb, we limit use to models/algorithms that are able to generate new global predictions (per soil variable of interest) within max 24–48 hrs.
What do the filename codes mean?
SoilGrids uses unique codes for names of variables. Layer naming is based on the simple convention where first three capital letters refer to the soil variable type (e.g. ORC = soil organic carbon mass fraction), the second three letters refer to the estimation method (e.g. DRC = dry combustion). The variables currently predicted in SoilGrids are:
| Variable code | Description | Units |
|---|---|---|
| ACDWRB | Grade of a sub-soil being acid e.g. having a pH < 5 and low BS | grade |
| AWCh1 | Available soil water capacity (volumetric fraction) with FC = pF 2.0 | percentage |
| AWCh2 | Available soil water capacity (volumetric fraction) with FC = pF 2.3 | percentage |
| AWCh3 | Available soil water capacity (volumetric fraction) with FC = pF 2.5 | percentage |
| BDRICM | Depth to bedrock (R horizon) up to 200 cm | cm |
| BDRLOG | Probability of occurrence of R horizon | percentage |
| BDTICM | Absolute depth to bedrock | cm |
| BLDFIE | Bulk density (fine earth) | kg/m3 |
| CECSOL | Cation Exchange Capacity of soil | cmolc/kg |
| CLYPPT | Weight percentage of the clay particles (<0.0002 mm) | percentage |
| CRFVOL | Volumetric percentage of coarse fragments (>2 mm) | percentage |
| HISTPR | Histosols probability cumulative | percentage |
| OCDENS | Soil organic carbon density | kg/m3 |
| OCSTHA | Soil organic carbon stock | ton/ha |
| ORCDRC | Soil organic carbon content | permille |
| PHIHOX | pH index measured in water solution | pH |
| PHIKCL | pH index measured in KCl solution | pH |
| SLGWRB | Sodic soil grade | grade |
| SLTPPT | Weight percentage of the silt particles (0.0002–0.05 mm) | percentage |
| SNDPPT | Weight percentage of the sand particles (0.05–2 mm) | percentage |
| TAXOUSDA | Keys to Soil Taxonomy suborders | - |
| TAXNWRB | World Reference Base legend | - |
| TEXMHT | Texture class (USDA system) | - |
| WWP | Available soil water capacity (volumetric fraction) until wilting point | percentage |
The next component of the file name is the depth level, for instance, sl1 refers to the standard depth 1 i.e. 0 cm. The characters M, U and L refer to predicted mean value and the upper and lower limits of the 90% confidence interval. Each filename therefore specifies variable type, effective depth, prediction type (mean value, upper or lower confidence limits) and production date:
-
ORCDRC_sl1_M_250m.tif
which means: predicted mean value of soil organic carbon mass fraction at standard depth of 0 cm (soil surface). Standard depths / standard thicknesses are based on the GlobalSoilMap project recommendations:
| sl1 | sl2 | sl3 | sl4 | sl5 | sl6 | sl7 | |
| Standard depth (in meters): | 0.0 | -0.05 | -0.15 | -0.30 | -0.60 | -1.0 | -2.0 |
| Standard depth (in cm): | 0 cm | 5 cm | 15 cm | 30 cm | 60 cm | 100 cm | 200 cm |
Bulk estimates of values for standard depth intervals, e.g. 0–5 cm, can be derived, if required, by taking the average of the predictions at the upper and lower boundary of the depth interval (e.g. sl1 and sl2), or a weighted average from multiple depths using the trapezoidal rule for numerical integration (see Hengl et al. 2016 for more details).
| sd1 | sd2 | sd3 | sd4 | sd5 | sd6 | |
| Standard depth (in cm): | 0–5 cm | 5–15 cm | 15–30 cm | 30–60 cm | 60–100 cm | 100–200 cm |
How were the legends generated?
For each soil variable we use a standard global legend, based on the global sample histograms derived from the compilation of soil profile data available via the ISRIC WoSIS database. Soil legends are available via the GSIF package for R and can be used to program data visualization.
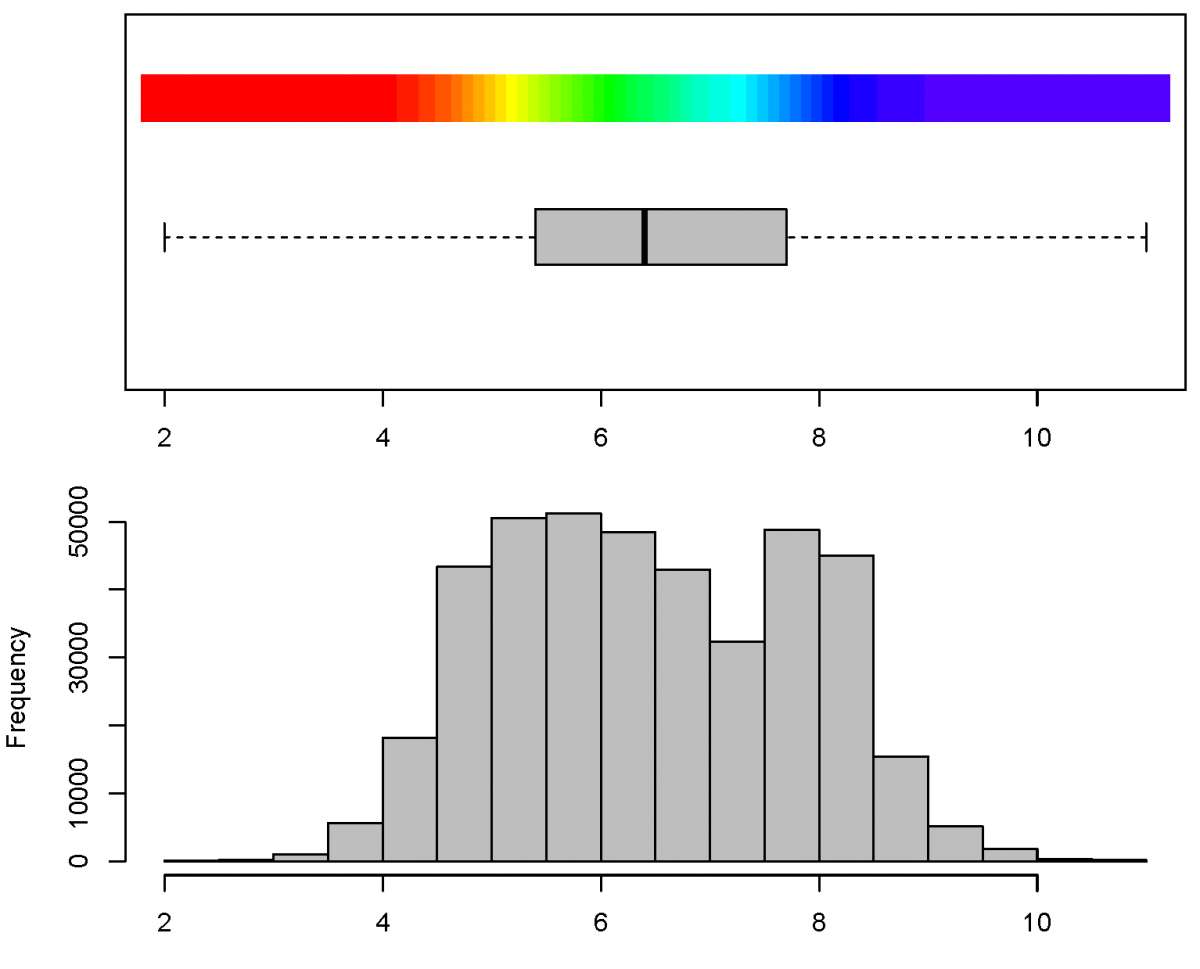
Histogram for soil pH (in H2O) and connected color legend. Note: breaks in the legend colors have been selected using histogram equalization (i.e. by using constant quantiles) to ensure maximum contrast in the output maps.
How were the spatial predictions generated?
Spatial predictions were produced using machine learning techniques random forest and gradient boosting as implemented in the packages ranger, xgboost, nnet and caret. The code used to generate SoilGrids is fully documented via the ISRIC's Github account.
We aim at using state-of-the-art statistical methods for soil mapping, implemented in the Open Source environment for statistical and geographical computing (Bivand et al. 2013). The models are tailored per soil property and are fitted using documented models. For each soil variable we fit a global model, which can also be used as a global reference model for any similar statistical modeling. The initial statistical models will be gradually extended (or even replaced), hence improved versions of the spatial prediction models and improved output maps can be anticipated in forthcoming versions of SoilGrids (Hengl et al. 2014).
How to extend regression to regression-kriging?
For continents and regions, SoilGrids predictions can be used as a covariate to improve prediction of soil properties through e.g. regression-kriging. Simply download SoilGrids, run overlay with the point data and then use the SoilGrids layers as a covariate to predict or adjust the values of target variables locally. An example of how regional scale predictions can be extended to regression-kriging is described in Hengl et al. (2015).
Who makes the spatial predictions?
SoilGrids are based on automated soil mapping as implemented mainly using model-based statistics. Automated mapping (the "Global Soil Mapper" algorithm) implies that there is little human intervention in the mapping process. Global Soil Mapper is implemented using the R environment for statistical computing with dependencies to external software such as SAGA GIS, GDAL etc. So the correct answer to the question "who makes the maps?" is: "the computer software on a network of servers". Soil experts are, on the other hand, involved in the selection of the spatial prediction models and especially in review and evaluation of the outputs. So the final product is a result of a process that includes both computer programs and soil experts (soil experts filter / validate inputs and design the statistical models, predictions are then generated by a computer program).
How were the models selected?
Spatial prediction models are selected per each soil variable iteratively by evaluating the success of cross-validation and computing efficiency (Hengl et al. 2016). As with input data, the models used to make predictions in the SoilGrids framework can be improved or replaced in subsequent iterations if better performing models are identified. The actual modeling approach used to produce any set of predictions will be reviewed continuously to identify and apply the approach that produces the most correct, consistent and usable outputs.
What soil data is included?
SoilGrids contains 3D predictions and associated prediction accuracies of basic soil properties, following the GlobalSoilMap specifications: organic carbon, pH, texture fractions, coarse fragments, bulk density, depth to bedrock (R horizon) and CEC at six standard depths, and predictions for soil types based on the FAO's World Reference Base classes and USDA's Soil Taxonomy classes (Hengl et al. 2014). List of targeted soil variables will be gradually extended based on user requests.
How much does it cost?
The SoilGrids products are since 2016 registered under the Open Data Commons Open Database License (ODbL) (publicly accessible environmental data; see also the general ISRIC software and data policy) and is being offered in support of the Global Soil Partnership initiative and other public global soil data projects (for a review of global soil mapping initiatives and data sets see: Grunwald et al. 2011 and/or Omuto et al. 2013). The SoilGrids objective is: "global soil data anywhere, anytime, for everyone".
How can I access SoilGrids?
SoilGrids is an Open Soil Data project, hence access to the data should not be a problem. You can access, download and import SoilGrids predictions via WebDAV.
Why coarse resolution?
Producing global soil information requires extensive infrastructure and resources. ISRIC has tried to use limited funding and resources to deliver complete and consistent global soil information products in the shortest possible time — hence 1 km, 250 m resolution (Hengl et al. 2014). SoilGrids1km and SoilGrids250m are a step towards 100 m global soil property maps however, many global modeling applications may already be satisfied with 1 km resolution or coarser. The GlobalSoilMap project aims to deliver maps at a finer target resolution of 100 m, suitable for the most intensive applications, by 2018 (McKenzie et al. 2013). A 1 km resolution still implies an enormous amount of soil data however — the global soil mask at 250 m contains about 1.4 billion pixels!
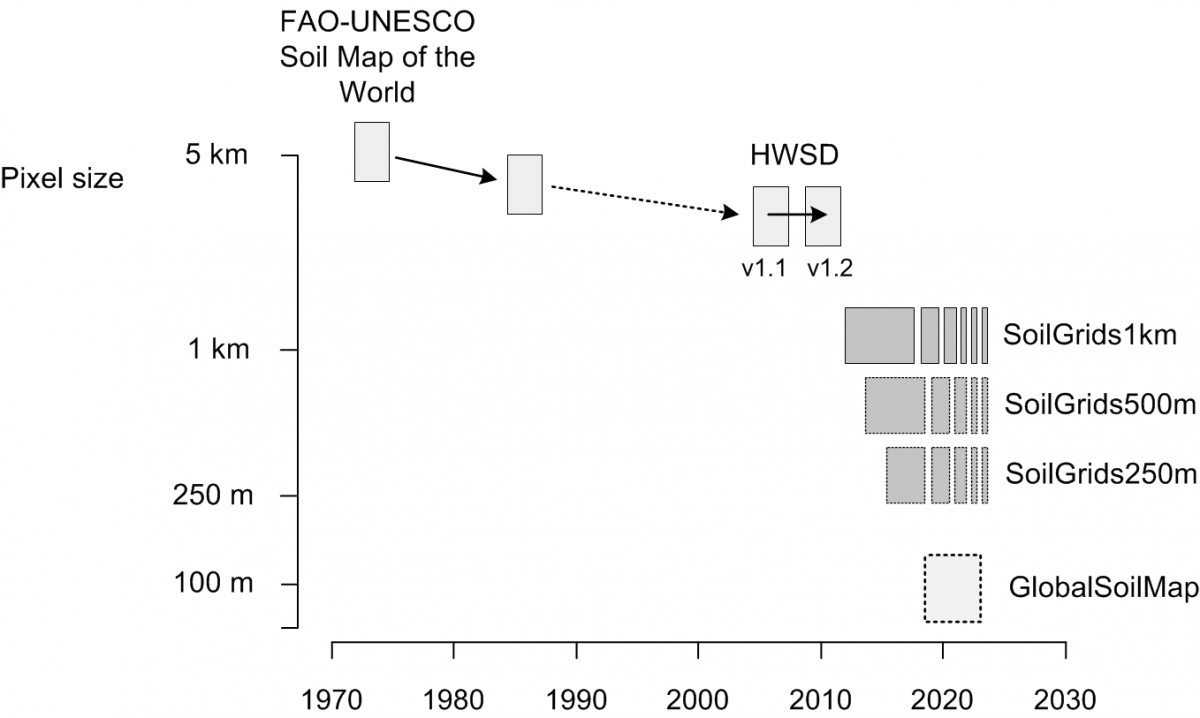
SoilGrids are a step toward reaching a global soil information system.
SoilGrids can be considered the "coarsest" component of the global soil variation "signal" curve. Other components, e.g. finer products based on local / more detailed 250–100 m resolution imagery, could be added to produce a merged product.
Soil mask map
The soil mask map is an approximation of global coverage of soils i.e. where soil occurs. It can be downloaded from the WorldGrids repository. The soil mask has been derived based on vegetation, land cover and water masks, and it distinguishes between soils with vegetation cover, soils with no vegetation cover and urban areas. Within the SoilGrids project, predictions have been produced only for areas with vegetation cover and urban areas. No estimate is provided for permanent ice areas because these are areas with extreme climatic conditions which are often ignored by soil surveyors. As these areas are often underrepresented by soil surveys, it would be relatively difficult to fit any reliable statistical models in these regions. In the case of SoilGrids250m, predictions were also produced for deserts and arid areas.
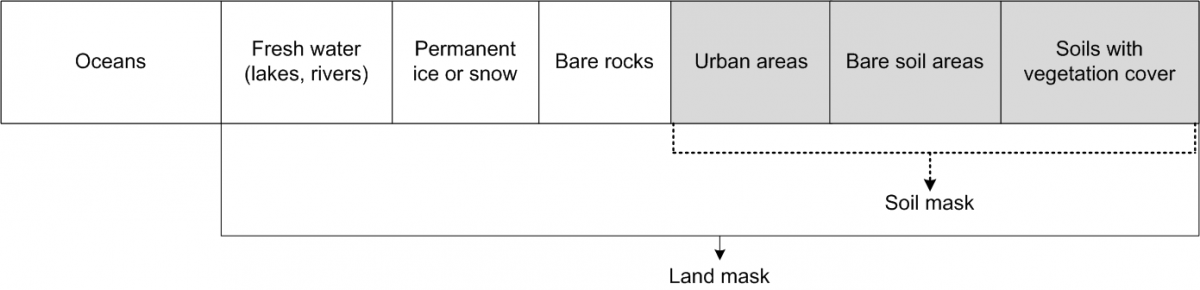
Global soil mask map can be derived using a combination of land cover maps and biomass / urbanization indices.
How is SoilGrids related to the GlobalSoilMap project?
SoilGrids tries to follow closely the GlobalSoilMap specifications (GlobalSoilMap specifications), but primarily focuses on coarser resolution predictions (1 km, 250 m). SoilGrids portrays only global, or coarse scale, variation of soil properties and the general idea of our approach to global soil mapping is that coarser resolution imagery should be merged with finer resolution soil property maps (100 m, 30 m and finer) produced by local, national and regional agencies. The merged product would possibly be the best possible combined prediction of soil properties / classes that can then serve decision makers. We refer to this is as the "participatory top-down / bottom-up approach to multiscale soil data merging". The data merging (or data fusion) principle is explained in the scheme below.
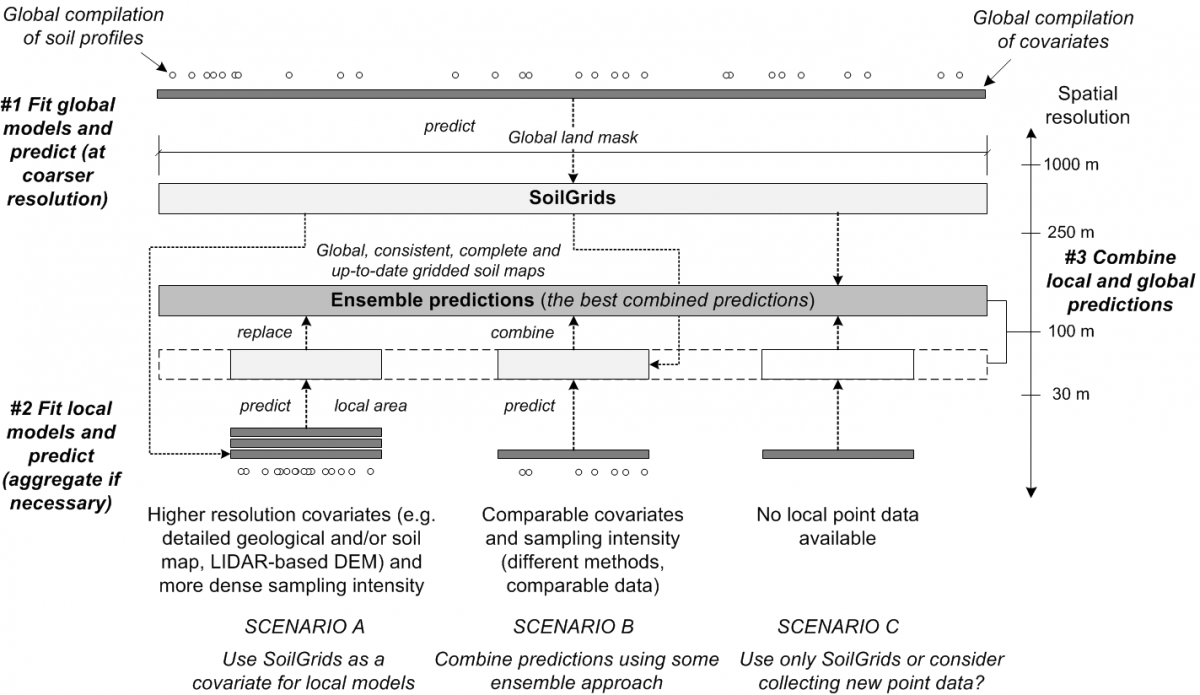
A proposed global framework for multiscale merging of spatial predictions: the top-down / bottom-up approach.
Another difference between SoilGrids and GlobalSoilMap is that SoilGrids also provide predictions of soil types (FAO's World Reference Base Groups and USDA's Soil Taxonomy suborders), while GlobalSoilMap focuses only on 10+ soil properties.
Why does SoilGrids also include maps of soil types?
Although there is a general tendency within the GlobalSoilMap consortium to focus on mapping primary and derived soil properties, as these are likely the key to spatially explicit soil management, ISRIC recognizes the value of soil classification systems: FAO's World Reference Base and USDA's Soil Taxonomy. For this reason soil classes e.g. FAO's World Reference Base Groups, are predicted per pixel including the probabilities and the uncertainty. Soil types can be used to infer other soil properties not covered by the spatial prediction modeling, and therefore provide a soil information system that is more complete than just a select number of soil properties.
 |
 |
SoilGrids contain also spatial predictions for soil classes based on the two most-used international classification systems.
How accurate are SoilGrids predictions?
The actual mapping accuracy of each targeted soil property and classes is still limited: the amount of variation explained by the models ranges between 30 and 70%. On the other hand, and in comparison to other previous global soil databases, SoilGrids provides an objective estimate of the uncertainty of mapping (average overall error of estimated prediction error). The confidence limits can be used to assess the impact of uncertainty in soil predictions on scenario / model testing through e.g. error propagation techniques.
Within the SoilGrids project, there is a clear intention to gradually improve predictions by incorporating more shared soil profiled data and by improving the models used. We hope to produce and distribute increasingly accurate maps after every run. Therefore, please consider contributing point or covariate data to help us incrementally improve the predictions.
How can I help improve SoilGrids?
The initial SoilGrids1km outputs were produced using a compilation of national and regional soil profile databases. To improve predictions for your country or region, consider contributing soil profile data to the ISRIC's WoSIS database or by submitting the whole database in some standard database format so that your point data can be also utilized to generate improved predictions. Agencies that contribute >1000 profile observations or soil samples for an area of at least 10,000 km2, can be listed as a co-authoring organization on the main SoilGrids web-mapping portal. Medium (200–1000 points) to small size (<200 points) contributors are invited to submit their data by contacting Luís de Sousa.
If you are able to produce predictions (for local areas e.g. regions or countries) of SoilGrids soil variables at accuracy as good as or better than what we produce, you can also submit your predictions and we will integrate (merge) your predictions with the existing SoilGrids to produce what we call "SoilGrids+" product (i.e. locally improved global soil grids). The general requirements to include your local predictions in the SoilGrids+ product are as follows:
- that they have a compatible licenses (see a list of CC-BY-SA / ODbL compatible data licenses), and
- that they follow the same technical specifications as SoilGrids (standard depths, standard reference methods, metadata specifications)
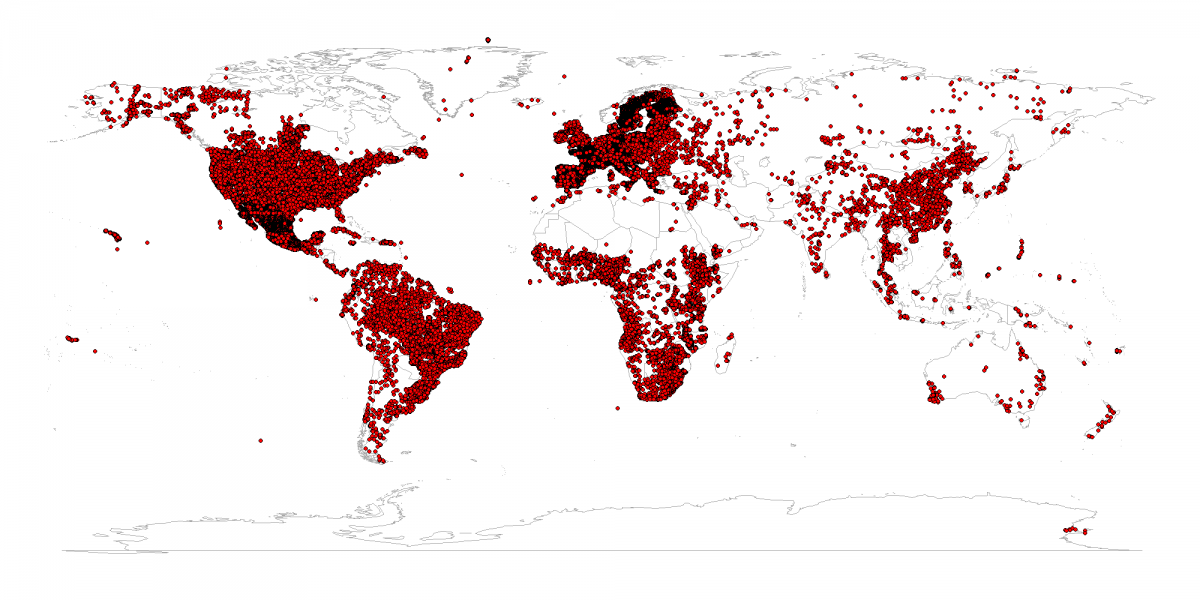
Compilation of soil profile data sets used as input for fitting spatial prediction models.
How can SoilGrids help me improve soil maps for my country?
The SoilGrids framework is intended to facilitate global soil data initiatives and to serve as a bridge between global and local soil mapping. Contact us for applying the facilities together with you to generate predictions for your area of interest. We are looking forward to developing multiscale spatial inference systems for producing best possible predictions of soil properties and classes locally and globally.
Suggested uses of SoilGrids by national and regional agencies are:
- as a covariate layer for regional mapping (see Hengl et al, 2015),
- as an input to generating ensamble predictions,
- to fill-in gaps in the existing soil information systems,
Cited sources
- Bivand, R. S., Pebesma, E. J., & Rubio, V. G. (2013). Applied spatial data: analysis with R. Springer, 2nd Ed..
- Brown, P. E., (2015). Model-Based Geostatistics the Easy Way. Journal of Statistical Software, vol 63.
- Diggle, P. J., & Ribeiro, P. J. (2007). Model-based geostatistics. Springer.
- Grunwald, S., Thompson, J. A., & Boettinger, J. L. (2011). Digital soil mapping and modeling at continental scales: Finding solutions for global issues. Soil Science Society of America Journal, 75(4), 1201-1213.
- Hastie, T. J. and Pregibon, D. (1992) Generalized linear models. Chapter 6 of Statistical Models in S eds J. M. Chambers and T. J. Hastie, Wadsworth & Brooks/Cole.
- Hengl T, de Jesus JM, MacMillan RA, Batjes NH, Heuvelink GBM, et al. (2014) SoilGrids1km — Global Soil Information Based on Automated Mapping. PLoS ONE 9(8): e105992. doi:10.1371/journal.pone.0105992
- Hengl T, Heuvelink GBM, Kempen B, Leenaars JGB, Walsh MG, Shepherd KD, et al. (2015) Mapping Soil Properties of Africa at 250 m Resolution: Random Forests Significantly Improve Current Predictions. PLoS ONE 10(6): e0125814. doi:10.1371/journal.pone.0125814
- Hengl, T., Mendes de Jesus, J., Heuvelink, G. B.M., Ruiperez Gonzalez, M., Kilibarda, M. et al. (2017) SoilGrids250m: global gridded soil information based on Machine Learning. PLOS One, PLoS ONE 12(2): e0169748. doi:10.1371/journal.pone.0169748
- McKenzie, N., Baritz, R., Castro, A., Hempel, J., Yemefack, M., Moussadek, R., Zhang, G., Vargas, R. (2013). Draft Plan of Action for Pillar Four of the Global Soil Partnership: Building an enduring and authoritative global system to monitor and forecast the condition of the Earth’s soil resources. FAO Global Soil Partnership, Rome.
- Montanarella, L., & Vargas, R. (2012). Global governance of soil resources as a necessary condition for sustainable development. Current Opinion in Environmental Sustainability, 4(5), 559-564.
- Omuto, C., Nachtergaele, F., and Vargas Rojas, R. (2012). State of the Art Report on Global and Regional Soil Information: Where are we? Where to go? Global Soil Partnership technical report. FAO, Rome.
- Venables, W. N. and Ripley, B. D. (2002). Modern applied statistics with S. Springer, 4th Ed.