 for organic carbon (permille) for the first standard depth (0-5 cm)")
Overview
ISRIC's soil mapping team, together with the AfSIS project team, has produced predictions of soil properties at 1 km resolution using an automated mapping framework (3D regression kriging). The inputs to the framework are legacy soil profiles data - about 12,000 locations (50,000 samples) in Africa - and several tens of environmental covariate layers available via WorldGrids.org. The GeoTiffs of the soil property maps are available for download below as compressed files, together with all metadata, input data sets and the R scripts used to generate the maps. To decompress the files use the 7z program. The input data sets are available only as RDA files (R compressed binary format) and require R software and associated packages (sp, rgdal, gstat, aqp, raster, splines, GSIF, ...).
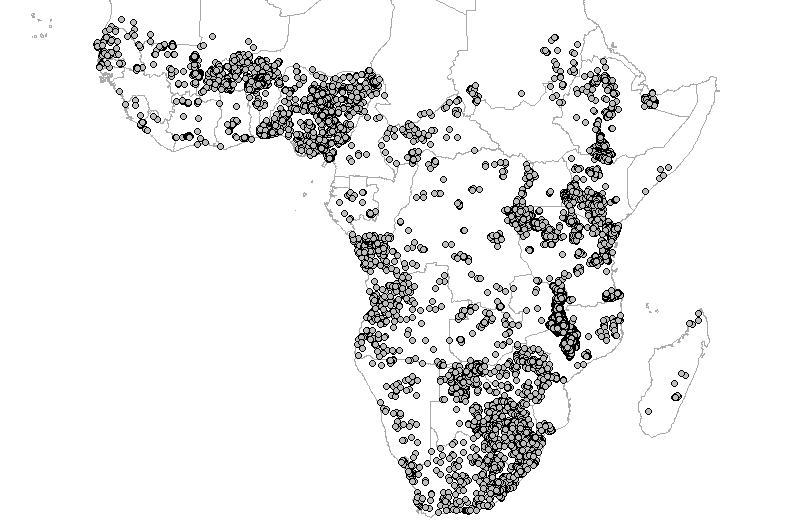
Soil profiles locations from the Africa Soil Profiles Database (AfSP; Leenaars, 2012)
Specifications
Output maps were produced to comply with the GlobalSoilMap.net/specifications (except for the resolution which has been set at 1 km). One soil variable (one zipped file) typically includes 18 maps: mean and upper and lower limits of the (symmetric) 90% probability confidence limits at six standard depths. For example: upper and lower limits of the (symmetric) 90% probability confidence limits at six standard depths. For example:
- ORCDRC_sd1_M - predicted mean organic carbon content in permille for the first standard depth (0-5 cm);
- ORCDRC_sd1_L - lower limit of the 90% prediction interval of organic carbon in permille for the first standard depth (0-5 cm);
- ORCDRC_sd1_U - upper limit of the 90% prediction interval of organic carbon in permille for the first standard depth (0-5 cm).
The six standard depth intervals in the GlobalSoilMap.net/specifications are:
- sd1: 0-5 cm
- sd2: 5-15 cm
- sd3: 15-30 cm
- sd4: 30-60 cm
- sd5: 60-100 cm
- sd6: 100-200 cm
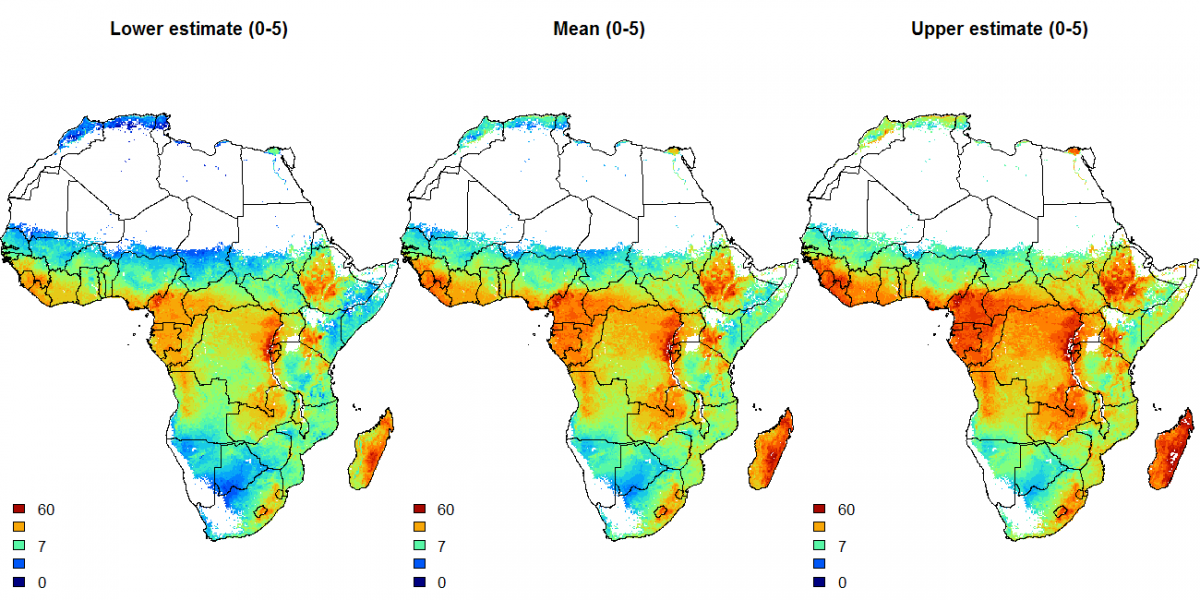
Prediction maps of the lower limit, mean and upper limit (90% prediction interval) for organic carbon (permille) for the first standard depth (0-5 cm). White pixels indicate areas without any vegetation cover that have been masked out from the mapping.
Within the project, we use a standard 8.3 filename convention with at most eight characters, so for example in the case of "ORCDRC_1":
- The first three letters are used to represent the soil variable of interest, e.g. "ORC" is organic carbon content in permille;
- The next three letters represent the data source or collection method, e.g. "DRC" is the Dry combustion method;
- The 7th and 8th character are reserved for the depth or sequence horizon, e.g. "_1" for the first standard depth (0-5 cm).
Spatial reference
All predictions were produced at point support (centre of grid cells). Because the interpolation is done in 3D, the grid cells are three dimensional blocks (or voxels) with different thickness for each standard depth (e.g. 1 km by 1 km by 0?5 cm for first layer; 1 km by 1 km by 5?15 cm for the second). All maps are projected in the pan-African equal area coordinate system with the following proj4 string:
"+proj=laea +lat_0=5 +lon_0=20 +x_0=0 +y_0=0 +units=m +ellps=WGS84 +datum=WGS84"
Predictions have been made only for the areas of soils with vegetation cover. All drylands, deserts and areas without any vegetation cover since the start of the MODIS mission have been masked out. The non-vegetated land areas were masked out because soil formation factors in the extreme climatic conditions are different from the soil forming factors under some or full vegetation cover and can be difficult to model with current point data. Very little point observations are available at the moment e.g. in the African deserts, so that any prediction model would have to extrapolate and would probably lead to artifacts. Soil predictions for the complete soil mask (any unconsolidated soil material with or without vegetation cover) are planned for the next phase of the project.
Accuracy
The accuracy of the maps has been assessed using 5-fold cross-validation and has been derived as 1-MSE/sigma, where MSE is the mean square error at validation points and sigma is the total variance for the target variable. The % of variance explained has always been derived in the transformed (trans-Gaussian) space and should be considered as an approximation of the true map accuracy only. The true accuracy of the resulting maps depends on the quality of the input data and the interpolation method used. The legacy dataset (Leenaars, 2012) may seem large but in fact 12,000 profiles for the whole of Africa (18.3M pixels) means that one point has been used to predict about 1500 pixels (or about 10 times worse than standard for this scale; see Hengl (2006) for more details), and interpolations over large distances occur, also because the data locations are fairly clustered with large gaps for some parts of Africa. The covariate data can partly compensate for this because they exploit the relationship between soil property and covariates, but the goodness-of-fit of the multiple regressions ranged between 18% to 48%. Thus, these soil property maps should be only considered a first step in a process towards more accurate soil property mapping for Africa, which should incorporate a much denser dataset and possibly additional soil information such as contained in legacy soil type maps.
Updates and improvements
The Africa soil property maps at 1 km have been produced using an automated spatial prediction framework, which has been fully documented and allows for reproducible research. The framework will be regularly updated and improved using new list of covariates and new spatial prediction methods, thus please refer to the date of access when using the maps for GIS modelling purposes, as there might be differences between different versions of maps. Before using these maps for decision making purposes, please read the general disclaimer.
The gridded predictions presented here represent a step toward the African Soil Information System at multiple resolutions. For more information please refer to the AfSIS project at Africasoils.net. Possible uses of these maps include but need not be limited to:
- Soil-environmental modelling, land degradation studies, soil-landscape planning, biodiversity assessment (continental scale or country scale models);
- General assessment of soil characteristics for the African continent (e.g. total carbon stock) and further planning of soil surveys;
- Downscaling and/or merging of the coarse resolution maps with finer resolution maps (500 m, 250 m and 100 m);
The AfSIS project has been funded by the Bill and Melinda Gates foundation and the Alliance for a Green Revolution in Africa (AGRA). To learn more about this project, visit the project website Africasoils.net and/or the AGRA website.
Download compressed geotiffs
Please note: AfSoilGrids1km is superseded and has been replaced by AfSoilGrids250m.
Visit our Soil Data Hub to download AfSoilGrids250m data layers (Africa SoilGrids).
Citation
ISRIC – World Soil Information, 2013. Soil property maps of Africa at 1 km. Available for download at www.isric.org.